Happy New Year 2024! The time of resolutions and pledges to do better. Let me suggest another one to add to your company or personal goals: be a better listener. I’ve spent a lot of time saying the greatest value I’ve observed in conversational AI solutions is the new lens into the customer or team member, not the self-service. Yes, self-service is very valuable too, but you can’t even know if you’re doing it right without the right visibility to your overall journeys. Your customers might have hundreds of reasons for contacting you. Many that you considered, many that you didn’t, and many that don’t exist today but could tomorrow. You might change a price, or launch a new product or feature, maybe one of your backend processes suddenly stopped working and your customers notice before your team. What if you could have granular insights to what people are saying to the age-old question… How may I help you?
It’s not very likely you’ll define all the reasons someone could contact you and present them as options. The cognitive burden would be ridiculous. There is a team or multiple teams of people (or a bot!) that can handle a broad range of drivers. We only need to give you a few choices to connect you with the right team that can handle, say, 30% of customer life-cycle activities. Having simple options like “Customer Service” or “Sales” makes perfect sense. It’s great. Press a button, wait in queue, speak to a person, then when the call is over the agent gets to press another button that generalizes what the contact was about. Are you going to have several hundred wrap-up codes for agents to tag calls when they have a short-measured wrap-up time before taking the next call to flag the call and leave detailed notes in a customer relationship management (CRM) system? No again! These are over generalized codes. Wrap-up or disposition codes miss the finer details of what people say to your business or team.
What do you get out of contact centre reporting? Well, at the start of the call, you can identify breakdowns like % of customers that pressed option 1, 2, or 3 – which those of us from the contact centre industry also know aren’t indicative of what they were calling about. Many customers have tuned into the fact that there are likely queues that are less busy than others and assume that the incorrect team can either help them or transfer them through more quickly than had they waited in the correct queue from the start.

And what about after the contact? We get less generalized categories like “Billing Question” or “Billing Inquiry”, not, “we overcharged them by $20”, or “they never received their bill but were charged”. Does your website or phone systems have a dedicated menu option for the later two exact scenarios? Likely not, but I wouldn’t be sure whether to congratulate your phone system, website, and contact centre reporting teams or sympathize with customers or agents if they did.

These examples are over simplified, sure, but the truth is often not that far off for many businesses. Identifying subtle patterns is very difficult without doing lots of laborious work fine-tuning wrap-up codes into detailed drivers based on CRM notes.
Okay, so let’s get to what I’m recommending here. When I talk about the lens into the customer being more valuable than self-service, let’s consider where the interactional data resides today:
| Interactional Data Source | Availability to Analytics | Description |
| 1. Up-front contact driver statements, selections, and expressions (the IVR or the bot) | Near-real-time* as it’s being said | As soon as the bot or system receives the utterance or selection, it can be passed as an event to a persisted pipeline and then ingested and processed for analytics and monitoring/alerting. |
| 2. Post-contact Wrap-up/Disposition, Recordings, and Transcripts | Near-real-time or Batch+ after contact completion | Once an interaction is complete, recording files can be closed and transcribed, transcripts for chat conversations can be closed, wrap-up codes get added to reporting, and everything moves on. Some platforms do provide real-time events for these occurrences, others don’t. What’s more important is that they occur at the end of an interaction, as opposed to the start of one. There are missed opportunities for analytics if you only rely on windowed reporting over the end of interactions. |
| 3. Other systems and sources of data. | Near-real-time* or Batch+ after contact completion | I use this category for things that are not part of a platform like a contact centre or communication platform as-a service (CPaaS) that has communication-event-based insights and reporting. These interactions could be ticketing systems, direct email communications, virtual meeting transcriptions, written meetings notes, PDF copies of physical letters exchanged, and much more. |
* System support may affect this, but most types of IVRs and bot platforms support webhooks where you can deliver near-real-time events into your processing pipeline.
+ If you need to rely on polling for data from a contact centre reporting API, or a database, you will need to determine what is an adequate processing time for the batch, but I recommend it be relatively frequent for reason detailed in this blog.
Imagine a scenario where you offer a regionalized service to consumers, let’s use internet to lean into my experience, and that one of your largest regions begins to experience a new and unexpected issue, resulting in swarms of incoming contacts through web, phone, social media, and other available channels. For those of you who haven’t worked at an internet service provider before, identifying a region is down and adequately equipping the contact centre agents with information on handling the situation came take considerably longer than you might imagine, even if monitoring teams identify the issue within minutes. How long does it take to identify the emergent problem? Well, if we built analytics and monitoring on top of interactional data source #1 from the above table, we’d be able to dig into what’s happening as soon as the spikes of interactions begin. Getting alerted on spikes of contacts is old hat. If we were only looking at data from source #2 or #3, you would have to wait until a representative number of interactions concluded before you could even begin to process them with group discussions, analytics, or automated alerting.
I’ve gone off topic, but I’ll end the tangent on why you should use a bot as the front-door to your customer service with this: Even if all your bot does is begin communications with “how may I help you?” and then route the contact to the appropriate team, there is tremendous value in that solution, because you can extract granular contact drivers at the START of interactions, rather than after the END. The analytics approach and code I will share in this post applies to either.
I ended 2023 by sharing a way to catalogue interactional solution requirements, the SECTIONAL framework ™ [1], and a GitHub repo [2] with a Python notebook to ideate important data points to feed into the (E)ntities section of the framework. We used some natural language processing (NLP), machine learning (ML) clustering, and large language models (LLMs) to generate 500 example transcripts between a caller and an assistant answering calls for someone else and reschedule a follow-up, and extract ideas for what things people were talking about. In a new Python notebook associated to this blog, we’ll expand on the previous one to focus on User interactions, grouping smaller semantically similar clusters into larger ones, and how to detect emerging drivers and entities. It’s important to note that these results are probabilistic in nature and require human-in-the-loop to fine-tune and validate. The idea is that it’s good enough to use with human-in-the-loop supervision and fine-tuning of outputs in a way that takes considerably less effort than reading CRM notes and listening to call recordings or reading transcripts on a small sample of data to produce granular driver reports.
I will leave the reader to explore the notebook, but what I want to focus on is the fact that with a laptop, very little code, the ability to run a Python Jupyter notebook, and an OpenAI API key, and transcripts in-hand, you can gain a considerable amount of insight in minutes or hours. I love and use PyCharm [3] as a development environment for Python projects, including notebooks, but there are free alternatives.
Using the examples in the notebook, we took 500 generated transcripts, grouped semantically similar utterances into “intents”, named them, and then grouped them into higher level categories. We then introduced a new “emergent” scenario through 25 more transcripts (+5% interactions/utterances) and when comparing the analysis outputs, we can visually see and then manually confirm the new scenario and action it accordingly. The scenario introduced is that the reason for contact is because of a billing dispute of $5 or $7 dollars.
There is plenty of room for improvement and automation in this process. We should use better embeddings, improve pre-processing and clustering parameters, refine incorrectly marked clusters or noise, and much more. Perfect is the enemy of good enough to start today [4]. See for yourself, can you spot the driver that was picked up once I introduced it to the previously clustered data?
Intent groupings before adding 5% dispute transcriptions:

Intent groupings after adding 5% dispute transactions:

The exercise should show you an emergence of a billing or transaction dispute intent, along with the distribution of amounts of detected money entities.
money entity before adding 5% dispute transcriptions:
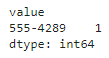
Only an invalid money entity is detected (see notebook for why).
money entity after adding 5% dispute transactions:
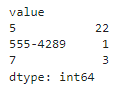
Ignoring the invalid phone number, we have a distribution of 88% of values are $5 and 12% of values are $7. I gave no instructions to the LLM on distribution of the amounts, but it looks like the correct amounts are present and recognized.
With these capabilities in hand, we can get a good idea of where we can see the biggest impact and where we can plug into and improve existing analysis processes. In my case, I have everything I need to continue writing about what’s next after completing the SECTION(AL) framework for my calendaring assistant. Okay, maybe I already had that after the last blog post, but I didn’t feel I did enough justice to highlighting how this relatively simple manual activity can give you new capabilities to understand text and even identify emerging trends.
Come along for more if you like reading about my thoughts, advice, assets, and frameworks on achieving better decisions and outcomes on the full life cycle for automation and interactional solutions. Reach out or say hi (or both!) and let me know how this blog post or Python notebook helped and how I can make it even more helpful!
References
| [1] | J. Randall, “The last SECTION(AL) of the year!,” Smart Interactive Transformations Inc., 23 12 2023. [Online]. Available: https://sitinc.wordpress.com/2023/12/23/the-last-sectional-of-the-year/. [Accessed 09 01 2024]. |
| [2] | J. Randall, “sitinc/journey-discovery-getting-started | Python notebook and modules to explore customer journey data.,” Smart Interactive Transformations Inc., [Online]. Available: https://github.com/sitinc/journey-discovery-getting-started. [Accessed 23 12 2023]. |
| [3] | JetBrains, “PyCharm: the Python IDE for Professional Developers by JetBrains,” JetBrains, [Online]. Available: https://www.jetbrains.com/pycharm/. [Accessed 09 01 2024]. |
| [4] | Wikipedia, “Perfect is the enemy of good,” Wikipedia, [Online]. Available: https://en.wikipedia.org/wiki/Perfect_is_the_enemy_of_good. [Accessed 09 01 2024]. |

Leave a comment